
Liver Iron Quantification Calculator for MRI
Related Calculators
Quantification of liver steatosis using attenuation or signal characteristics on CT and MRI imaging.
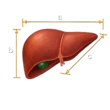
Liver volume estimation using imaging measurements with comparison to expected normal values.

Liver lesion classification for hepatocellular carcinoma risk using CT, MRI, ultrasound, and contrast-enhanced ultrasound.
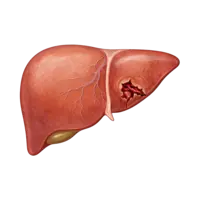
Liver injury grading using AAST criteria based on hematoma size, laceration depth, and vascular involvement.
More about the Liver Iron Quantification Calculator for MRI
Liver iron quantification with MRI provides a noninvasive method for estimating liver iron concentration (LIC), a commonly used surrogate biomarker of total body iron stores in patients with known or suspected iron overload. The 2023 ESGAR and SAR consensus identifies confounder-corrected R2*-based relaxometry as the preferred MRI method when available, with high-level evidence supporting use at both 1.5 T and 3.0 T.[1]
This liver iron calculator converts a previously measured hepatic R2* or reciprocal T2* value into an MRI-estimated LIC in milligrams of iron per gram of dry tissue. It uses the field-strength-specific multicenter, multivendor calibrations reported by Hernando and colleagues.[2] The calculator does not analyze MRI source images, fit multiecho data, or determine whether the entered R2* measurement was technically valid. The input measurement must therefore come from an appropriate liver R2* acquisition and reconstruction.
How the Liver Iron Quantification Calculator Works
Iron accelerates transverse MR signal decay. T2* describes the decay time in milliseconds, whereas R2* describes the corresponding relaxation rate in seconds-1. They are reciprocals. When T2* is expressed in milliseconds:
R2* (s-1) = 1000 / T2* (ms)
The calculator then applies the Hernando multicenter, multivendor R2*-to-LIC calibration corresponding to the MRI field strength.[2]
At 1.5 T:
LIC (mg Fe/g dry weight) = -0.16 + 0.02603 × R2* (s-1)
At 3.0 T:
LIC (mg Fe/g dry weight) = -0.03 + 0.01349 × R2* (s-1)
These equations were derived in a prospective study involving 207 participants with known or suspected iron overload studied across four centers and three MRI vendors. Reference LIC ranged from 0.3 to 42.5 mg/g. The investigators found reproducible R2*-to-LIC calibration within each field strength across participating centers and vendors.[2]
The study also reported a separate calibration for a 2.89 T MRI system. This calculator is intentionally limited to 1.5 T and 3.0 T. If the quantitative source data or protocol identifies the actual field strength as 2.89 T, the 3.0 T setting should not be substituted because the defining study reported a distinct 2.89 T calibration.[1][2] Some systems marketed within the 3 T class may operate at 2.89 T, so the field strength used for the quantitative acquisition should be verified when this distinction is relevant.[5]
Interpreting MRI-Estimated Liver Iron Concentration
Commonly used LIC interpretation thresholds summarized in the ESGAR and SAR consensus are:[1]
| MRI-estimated LIC | Interpretation |
|---|---|
| <1.8 mg Fe/g dry weight | Normal |
| 1.8 to <3.2 mg Fe/g dry weight | Borderline |
| 3.2 to <7.0 mg Fe/g dry weight | Mild iron overload |
| 7.0 to 15.0 mg Fe/g dry weight | Moderate iron overload |
| >15.0 mg Fe/g dry weight | Severe iron overload |
These categories describe iron burden. They are not, by themselves, a complete treatment algorithm. Management depends on the cause of iron overload, clinical status, laboratory findings, prior measurements, treatment history, and the reliability of the MRI measurement.
The calculator reports LIC to one decimal place and applies the interpretation category to that same reported value. This explicit implementation choice keeps the displayed LIC, category, and generated report internally consistent near category boundaries.
Why R2* Is Used for Liver Iron Quantification
R2* increases as hepatic iron concentration increases. Multiecho gradient-echo R2* mapping can provide whole-liver coverage rapidly, often within a breath hold. Contemporary chemical shift-encoded MRI can also estimate liver proton density fat fraction and R2* from the same acquisition, allowing liver fat and iron to be assessed together.[1][3]
The ESGAR and SAR consensus recommends R2*-based relaxometry as the first-line MRI method for liver iron quantification when an appropriate method is available. Both 1.5 T and 3.0 T can be used. In patients with known or strongly suspected severe iron overload, 1.5 T may be preferable because signal decay is faster at 3.0 T and the measurable dynamic range can therefore be more restricted.[1]
The R2* Measurement Must Be Compatible with the Calibration
The conversion equation is only one part of liver iron quantification. The validity of the final LIC estimate depends on the R2* value entered into the calculator.
Hepatic steatosis can bias R2* estimates when fat is not properly modeled. Noise-floor effects can also bias R2* fitting, particularly when signal decays rapidly. For these reasons, methods that correct for relevant fat and noise effects are preferred.[1][2]
The ESGAR and SAR consensus recommends optimized R2* techniques with a short first echo time, short echo spacing, adequate multiecho sampling, and appropriate noise handling. The consensus describes first echo times shorter than 1 ms, echo spacing shorter than 1 ms, and approximately six to 12 echoes as preferred technical characteristics for R2* liver iron quantification.[1]
Fat correction is particularly important for accurate R2* measurement in mild-to-moderate iron overload. In severe iron overload, fat correction becomes less important and may become technically impossible because spectral linewidth broadening causes fat and water peaks to blend.[1]
The Hernando multicenter calibration was derived using a centralized complex confounder-corrected R2* reconstruction. It should therefore not be assumed that every R2* number generated by every scanner, sequence, or reconstruction algorithm is automatically interchangeable with the measurements used to derive these equations.[2][4]
Vendor-Provided R2* Maps and Calibration Limits
A subsequent multicenter study evaluated how R2* measurements from vendor-provided reconstructions compared with the centralized reconstruction used to establish the Hernando multicenter calibration.[4]
Within defined ranges of agreement, vendor-derived R2* measurements produced LIC calibrations that agreed with the multicenter calibration. However, agreement deteriorated at higher R2* values. With the acquisition parameters and software versions evaluated in that study, vendor-provided R2* maps could be practically used with the multicenter calibration for LIC values below approximately 8.4 to 12.9 mg/g, depending on vendor and field strength. The study did not establish reliable vendor-map performance for the severe iron overload threshold of 15 mg/g under those acquisition conditions.[4]
Those results do not establish a universal 8 to 13 mg/g ceiling for current MRI systems. The usable range depends on the acquisition and reconstruction implementation. In the study itself, shorter echo times and lower spatial resolution were identified as approaches that can improve signal-to-noise performance and potentially extend the upper range, while software version and reconstruction method also affected agreement.[4]
At 3.0 T, a vendor-specific range of agreement could not be determined for the Siemens reconstruction because the product sequence did not directly support the standardized two-echo-train acquisition used in that study. The reported 3.0 T vendor-map limits therefore should not be interpreted as establishing a Siemens 3.0 T product limit.[4]
Overall, the vendor-map study demonstrates why the published R2*-to-LIC equation should not be applied indiscriminately to an arbitrary R2* map without considering how that map was acquired and reconstructed.
Very High Liver Iron Concentrations
R2* relaxometry has reduced dynamic range at very high iron concentrations because rapid signal decay can occur before it is adequately sampled. The ESGAR and SAR consensus states that R2*-based quantification may not be well suited for LIC values greater than approximately 40 mg/g at 1.5 T or approximately 26 mg/g at 3.0 T. In patients with known or highly suspected severe iron overload, 1.5 T may therefore be preferred.[1]
These values are approximate consensus limits for appropriately optimized R2* methods. They should not be interpreted as a guarantee that every vendor-generated R2* map remains reliable up to those LIC values. Individual acquisitions and reconstruction methods may have a substantially narrower usable range.[1][4]
When R2* is unexpectedly high, source images, echo timing, fitting quality, motion, signal-to-noise ratio, water-fat separation, and other technical factors should be reviewed before relying on the calculated LIC.[1][4]
Reporting Liver Iron Quantification
MRI does not directly measure tissue iron. It estimates LIC through an empirically calibrated relationship between tissue iron and MR signal decay. Different MRI methods and calibration standards can produce different relationships between the measured MR parameter and reported LIC.
The ESGAR and SAR consensus specifically recommends that when an MRI-derived LIC is included in a clinical report, the report include an appropriate literature citation describing both the MRI method and the laboratory reference value used as the LIC reference.[1]
The Hernando equations used by this calculator were calibrated against a commercial R2-based FerriScan LIC reference. The resulting values should therefore be understood on that FerriScan-referenced R2 LIC scale and should not be assumed to be numerically interchangeable with LIC estimates produced by calibration groups tied to different reference methods. Recent prospective comparison confirms that systematic bias can arise when different calibration groups are compared.[2][6]
This calculator's generated report identifies the Hernando multicenter, multivendor confounder-corrected R2* calibration and the selected field strength so that the method used for conversion remains explicit.
Important Limitations
This liver iron quantification calculator should be used only with liver R2* or reciprocal T2* measurements obtained from an appropriate MRI iron-quantification technique. It is not intended to convert arbitrary T2* or R2* values from other organs or unrelated pulse sequences.
The multicenter calibration study used a standardized commercial R2-based LIC measurement as its reference LIC method. The defining calibration therefore does not establish that every possible vendor-generated R2* map, sequence, or reconstruction algorithm is interchangeable with the centralized confounder-corrected R2* method used in that study.[2][4]
Motion, poor breath holding, low signal-to-noise ratio, inadequate early echo sampling, water-fat swaps, fat-related bias, noise-related fitting errors, and inclusion of vessels or other nonparenchymal structures can alter R2* measurements.[1][4]
The calculator estimates liver iron concentration. It does not determine the cause of iron overload, assess myocardial iron, prescribe phlebotomy or chelation, or replace patient-specific clinical interpretation.
Frequently Asked Questions (FAQs)
Can I enter liver T2* instead of R2*?
Yes, provided the T2* measurement represents the reciprocal of an appropriate hepatic R2* relaxometry measurement. The calculator converts T2* in milliseconds to R2* in seconds-1 using R2* = 1000/T2* and then applies the field-strength-specific R2*-to-LIC calibration.[1][2] A T2* value from an unrelated sequence or a method that is not compatible with quantitative liver iron relaxometry should not be entered simply because it is labeled T2*.
Should I choose 1.5 T or 3.0 T?
Select the actual field strength at which the liver R2* or T2* measurement was acquired. The calibration equations differ between 1.5 T and 3.0 T.[2] Both field strengths are acceptable when an appropriate technique is used, but 1.5 T may be preferred for known or highly suspected severe iron overload because 3.0 T has a more limited dynamic range.[1] If the quantitative source identifies a 2.89 T field strength, do not substitute the 3.0 T calculator setting because the defining study reported a distinct 2.89 T calibration.[1][2]
Can I use any R2* value generated by my MRI scanner?
Not automatically. The Hernando equations were derived using a centralized complex confounder-corrected R2* reconstruction. Vendor-provided R2* maps can agree well with that calibration over certain ranges, but performance varies with scanner, software, acquisition parameters, reconstruction method, and iron burden.[2][4] Before applying the calculator clinically, the local R2* technique should be appropriate for quantitative liver iron assessment and compatible with the calibration being used.
What do the normal, borderline, mild, moderate, and severe categories mean?
The calculator uses commonly cited LIC thresholds summarized by the ESGAR and SAR consensus: less than 1.8 mg/g is normal, 1.8 to less than 3.2 mg/g is borderline, 3.2 to less than 7.0 mg/g is mild overload, 7.0 through 15.0 mg/g is moderate overload, and greater than 15.0 mg/g is severe overload.[1] These categories describe liver iron burden and should be interpreted with the underlying disease, clinical history, laboratory data, prior MRI measurements, and technical quality of the examination.
What if the estimated LIC is very high?
Very high R2* values require additional technical scrutiny. The ESGAR and SAR consensus notes that R2*-based quantification may not be well suited above approximately 40 mg/g at 1.5 T or 26 mg/g at 3.0 T, and some vendor-provided maps may have lower practical limits depending on acquisition and reconstruction.[1][4] Review the source data and technique before treating a very high calculated LIC as quantitatively reliable.
Why can the calculator return "not reportable" for an extremely low R2* value?
The published linear calibration equations have small negative intercepts. Therefore, sufficiently low positive R2* values can mathematically produce a negative extrapolated LIC. A negative physical liver iron concentration is not meaningful. The calculator treats this edge case as not reportable, does not assign an iron-overload category, and prompts verification of the input, field strength, and measurement technique. This is a calculator safeguard rather than a published lower diagnostic threshold.
References
- Reeder SB, Yokoo T, França M, et al. Quantification of Liver Iron Overload with MRI: Review and Guidelines from the ESGAR and SAR. Radiology. 2023;307(1):e221856. doi:10.1148/radiol.221856. PMID: 36809220.
- Hernando D, Zhao R, Yuan Q, et al. Multicenter Reproducibility of Liver Iron Quantification with 1.5-T and 3.0-T MRI. Radiology. 2023;306(2):e213256. doi:10.1148/radiol.213256. PMID: 36194113.
- Guglielmo FF, Barr RG, Yokoo T, et al. Liver Fibrosis, Fat, and Iron Evaluation with MRI and Fibrosis and Fat Evaluation with US: A Practical Guide for Radiologists. RadioGraphics. 2023;43(6):e220181. doi:10.1148/rg.220181. PMID: 37227944.
- Simchick G, Zhao R, Yuan Q, et al. Practical Application of Multivendor MRI-Based R2* Mapping for Liver Iron Quantification at 1.5T and 3.0T. J Magn Reson Imaging. 2025;61(1):150-165. doi:10.1002/jmri.29401. PMID: 38662618.
- Pickles E, Kumar S, Brady M, Telford A, Pavlides M, Bulte D. Comparison of liver iron concentration calculated from R2* at 1.5 T and 3 T. Abdom Radiol (NY). 2023;48(3):865-873. doi:10.1007/s00261-022-03762-4. PMID: 36520162.
- Gandon Y, Chau THT, Borde P, et al. Comparison of hepatic iron quantification by MRI between 1.5 and 3 T, using different methods and conversion formulas. Eur Radiol. 2026;36(4):2813-2822. doi:10.1007/s00330-025-12027-9. PMID: 41014349.

Radiologist and Nuclear Medicine Specialist
Neuroradiology fellow at Johns Hopkins University
UT Southwestern Medical Center alumnus